Manpower Dynamics. Data Intelligence
Electrical and Mechanical Services
Electrical and mechanical engineering; Gas sector; Aircraft maintenance ...
Covers :
1. Electrical and mechanical engineering
- Contracting
- Electrical fitting with water plumbing
- Servicing
- Sizeable companies with related services
- Related educational institutes and government bureau/departments
2. Gas
- Gas supply
- Gas fitting, installation and maintenance
- Sizeable companies with related services
- Related educational institutes and government bureau/departments
3. Aircraft maintenance companies


Year 2021 Tooltips
Employees
0
0
0
0
Total
0
0
Vacancy rate: 4.1%
0
Vacancy rate: 3.0%
0
Vacancy rate: 3.2%
0
Vacancy rate: 1.4%
Total
0
Vacancy rate: 3.2%
All the percentages are rounded to nearest 0.1%.
0
0
0
Total
0
0
Turnover rate: 7.2%
0
Turnover rate: 5.5%
0
Turnover rate: 6.0%
0
Turnover rate: 7.1%
All the percentages are rounded to nearest 0.1%.
Employees
0
0
0
0
Total
0
0
Vacancy rate: 2.4%
0
Vacancy rate: 2.1%
0
Vacancy rate: 1.9%
0
Vacancy rate: 4.0%
Total
0
Vacancy rate: 2.1%
All the percentages are rounded to nearest 0.1%.
0
0
0
Total
0
0
Turnover rate: 7.2%
0
Turnover rate: 6.7%
0
Turnover rate: 3.3%
0
Turnover rate: 6.7%
All the percentages are rounded to nearest 0.1%.
Employees
0
0
0
0
Total
0
0
Vacancy rate: 0.0%
0
Vacancy rate: 6.0%
0
Vacancy rate: 10.1%
0
Vacancy rate: 10.6%
Total
0
Vacancy rate: 8.2%
All the percentages are rounded to nearest 0.1%.
0
0
0
Total
0
0
Turnover rate: 9.9%
0
Turnover rate: 6.6%
0
Turnover rate: 3.0%
0
Turnover rate: 1.8%
All the percentages are rounded to nearest 0.1%.
Monthly Income Tooltips
All the percentages are rounded to nearest 0.1%.
Monthly Income Tooltips
All the percentages are rounded to nearest 0.1%.
Monthly Income Tooltips
All the percentages are rounded to nearest 0.1%.
Preferred Education Tooltips
All the percentages are rounded to nearest 0.1%.
All the percentages are rounded to nearest 0.1%.
Preferred Education Tooltips
All the percentages are rounded to nearest 0.1%.
All the percentages are rounded to nearest 0.1%.
Preferred Education Tooltips
All the percentages are rounded to nearest 0.1%.
All the percentages are rounded to nearest 0.1%.
Recruitment Difficulties
1st
Lack of candidates with relevant experience
2nd
Alternative offers in the market
3rd
Insufficient trained/qualified manpower in the related disciplines
Recruitment Difficulties
1st
Unsatisfactory terms of employment
2nd
Lack of candidates with relevant experience
3rd
Alternative offers in the market
Recruitment Difficulties
1st
Unsatisfactory terms of employment
2nd
Unsatisfactory working environment
3rd
Lack of candidates with relevant experience / Alternative offers in the market
Manpower Demand
Job Level
Professional/ Technologist
Average Annual Growth
0
2021
Actual
0
2025
Forecast
0
Note(s):
(1) The figures included employees and vacancies.
(2) The manpower forecast is based on the historical manpower survey data, together with the market trends in a longer term, technological developments of the industry and other social-economic determinants.
All the percentages are rounded to nearest 0.1%.
Technician
Average Annual Growth
0
2021
Actual
0
2025
Forecast
0
Note(s):
(1) The figures included employees and vacancies.
(2) The manpower forecast is based on the historical manpower survey data, together with the market trends in a longer term, technological developments of the industry and other social-economic determinants.
All the percentages are rounded to nearest 0.1%.
Tradesman/ Craftsman
Average Annual Growth
0
2021
Actual
0
2025
Forecast
0
Note(s):
(1) The figures included employees and vacancies.
(2) The manpower forecast is based on the historical manpower survey data, together with the market trends in a longer term, technological developments of the industry and other social-economic determinants.
All the percentages are rounded to nearest 0.1%.
Manpower Demand
Average Annual Growth
0
2021
Actual
0
2025
Forecast
0
Note(s):
(1) The figures included employees and vacancies.
(2) The manpower forecast is based on the historical manpower survey data, together with the market trends in a longer term, technological developments of the industry and other social-economic determinants.
All the percentages are rounded to nearest 0.1%.
Report
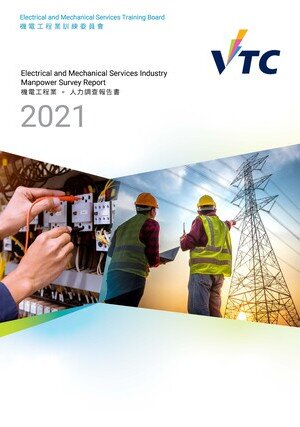
- Electrical and Mechanical Services
- 2021 Manpower Survey Report
The Number of Employees in E&M Engineering Sector Continued to Increase, Recording a Growth of 3.3% Compared with that of Last Round Survey in 2017
The Electrical and Mechanical (E&M) Engineering sector accounted for 90.2% of the manpower in the E&M Services Industry. The number of employees in this sector continued to increase, recording a growth of 3.3% compared with that of four years ago. On the other hand, the number of trainees and vacancies in the sector decreased by 13.5% and 20.2%, respectively.
- Electrical and Mechanical Services
- 2025 Manpower Update Report
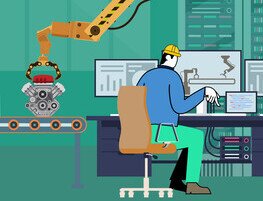
Electrical and Mechanical Services Industry Embraces Emerging Technologies to Boost Operational Efficiency
Government mega-projects have long been critical drivers for the E&M services and construction industries. The industry is experiencing a shifting manpower landscape due to the completion of many large-scale projects. E&M professionals who previously specialised in on-site installations for large construction projects have transited towards E&M maintenance work. The railway sector is expanding its operations and upgrading its existing network by integrating advanced technologies, while the aircraft maintenance sector has seen substantial advancements, particularly with the launch of the three-runway system at Hong Kong International Airport. These have led to increased demand for manpower in E&M engineering services. The Multi-trade Integrated Mechanical, Electrical, and Plumbing (MiMEP) technology is gaining widespread adoption in new construction projects. Workers only need to install the complete unit, rather than assembling each system individually. This streamlined process reduces construction time and boosts overall efficiency, demonstrating great promise in improving construction performance.