Manpower Dynamics. Data Intelligence
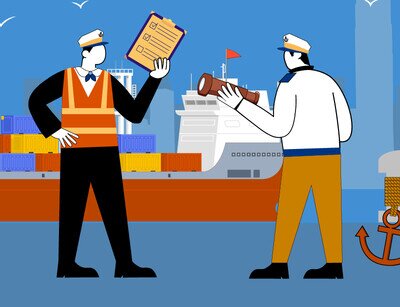
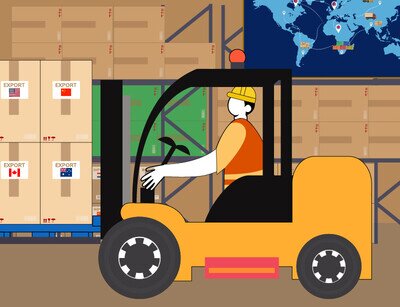
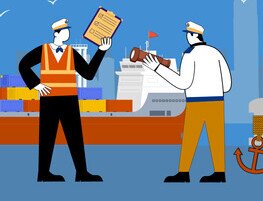
Transport and Logistics
Freight and Passenger transport in Land, Sea and Air; ...
Covers :
1. Freight transport
- Warehousing & cold storage
- Cargo handling terminals
- Trucking & container haulage
- Air freight transport
- Forwarding agent
- Stevedoring services
- Couriers (international)
- Sea freight transport
- Ship management & chartering
- Other transport logistics service providers
2. Passenger transport
- Vehicle and rail operators
- Vessel transport operators
- Aviation service operators


Year 2022 Tooltips
Employees
Managerial
0
Executive/ Supervisory
0
Clerical/ Craftsman/ Operative
0
Total
0
Managerial
0
Vacancy rate: 1.0%
Executive/ Supervisory
0
Vacancy rate: 1.7%
Clerical/ Craftsman/ Operative
0
Vacancy rate: 4.0%
Total
0
Vacancy rate: 3.4%
All the percentages are rounded to nearest 0.1%.
Managerial
0
Turnover rate: 5.2%
Executive/ Supervisory
0
Turnover rate: 6.9%
Clerical/ Craftsman/ Operative
0
Turnover rate: 13.5%
All the percentages are rounded to nearest 0.1%.
Employees
Managerial
0
Executive/ Supervisory
0
Clerical/ Craftsman/ Operative
0
Total
0
Note(s):
The figures did not include taxi and public light transport.
Managerial
0
Vacancy rate: 4.8%
Executive/ Supervisory
0
Vacancy rate: 9.2%
Clerical/ Craftsman/ Operative
0
Vacancy rate: 4.5%
Total
0
Vacancy rate: 5.6%
Note(s):
The figures did not include taxi and public light transport.
All the percentages are rounded to nearest 0.1%.
Managerial
0
Turnover rate: 4.0%
Executive/ Supervisory
0
Turnover rate: 4.2%
Clerical/ Craftsman/ Operative
0
Turnover rate: 17.3%
Note(s):
The figures did not include taxi and public light transport.
All the percentages are rounded to nearest 0.1%.
Preferred Education Tooltips
All the percentages are rounded to nearest 0.1%.
All the percentages are rounded to nearest 0.1%.
Preferred Education Tooltips
Note(s):
The figures did not include taxi and public light transport.
All the percentages are rounded to nearest 0.1%.
Note(s):
The figures did not include taxi and public light transport.
All the percentages are rounded to nearest 0.1%.
Recruitment Difficulties
1st
Candidates had more choices in the market
2nd
Candidates found the remuneration package and fringe benefit not attractive
3rd
Candidates were unsatisfied with the working environment in the industry
Recruitment Difficulties
1st
Candidates had more choices in the market
2nd
Candidates found the remuneration package and fringe benefit not attractive
3rd
Candidates were unsatisfied with the working environment in the industry
Manpower Demand
Average Annual Growth
0
2022
Actual
0
2026
Forecast
0
Note(s):
(1) The figures included employees and vacancies.
(2) The manpower forecast is based on the statistical modelling of relevant economic indicators which reflect important changes in the local economy, demography and labour market.
All the percentages are rounded to nearest 0.1%.
Manpower Demand
Average Annual Growth
0
2022
Actual
0
2026
Forecast
0
Note(s):
(1) The figures included employees and vacancies (except taxi and public light transport).
(2) The manpower forecast is based on the statistical modelling of relevant economic indicators which reflect important changes in the local economy, demography and labour market.
All the percentages are rounded to nearest 0.1%.
Report
- Transport and Logistics
- 2022 Manpower Survey Report
Manpower Statistics in the Midst of the Pandemic
The transport and logistics industry was badly hit by the pandemic with an overall decline of manpower of 5.5% when compared with that of 2018. In particular, the passenger transport sector has a negative change of 19.6% though the freight sector is relatively stable with a mild increase of 2.7%. Over 60% of the respondents reported that they had been facing recruitment difficulties at all job levels in the past 12 months. On the other hand, most respondents tended to emphasise on reducing operation costs and streamlining the organisation structure in their future plans while Hong Kong is moving along the path to normalcy.
- Transport and Logistics
- 2026 Manpower Update Report
Forging the Future: Building a Talent Pool for AI, Drones, Autonomous Systems, and ESG
The transport and logistics industry in Hong Kong is undergoing a paradigm shift, propelled by the convergence of AI, low-altitude economy, autonomous driving technologies and ESG. While the industry continues to face persistent manpower shortages in frontline roles, demand is rapidly pivoting toward new, tech-enabled positions. Specialised skills in AI applications, drone operations, autonomous systems, and ESG practices are now critical. This transformation underscores a pressing need to bridge the gap between emerging technologies and local talent supply. In response, concerted efforts should be made to strengthen talent pipelines, modernise training frameworks, and foster greater synergy between policymakers, educators, and industry stakeholders to equip the workforce for the demands of an increasingly technology-driven era.