Manpower Dynamics. Data Intelligence
Catering
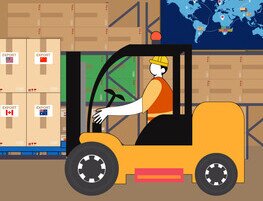
Restaurants; Fast Food Shops; Beverage Serving Places; Event Catering; Meal/ Food Service Activities; Restaurants in Clubs.


Year 2022 Tooltips
FT Employees
Managerial and Professional
0
Supervisory
0
Craft and Operative
0
Administrative and Others
0
Total
0
Managerial and Professional
0
Vacancy rate: 0.1%
Supervisory
0
Vacancy rate: 1.8%
Craft and Operative
0
Vacancy rate: 6.7%
Administrative and Others
0
Vacancy rate: 0.1%
Total
0
Vacancy rate: 5.3%
All the percentages are rounded to nearest 0.1%.
Managerial and Professional
0
Supervisory
0
Craft and Operative
0
Administrative and Others
0
Total
0
Managerial and Professional
0
Supervisory
0
Craft and Operative
0
Administrative and Others
0
Total
0
Managerial and Professional
0
Turnover rate: 2.6%
Supervisory
0
Turnover rate: 6.6%
Craft and Operative
0
Turnover rate: 26.3%
Administrative and Others
0
Turnover rate: 32.1%
All the percentages are rounded to nearest 0.1%.
Monthly Income Tooltips
2022
2018
All the percentages are rounded to nearest 0.1%.
Preferred Education Tooltips
All the percentages are rounded to nearest 0.1%.
All the percentages are rounded to nearest 0.1%.
Recruitment Difficulties
1st
Working conditions (e.g. working hours, shift work)
2nd
Competition for manpower from other industries
3rd
Terms of employment (e.g. compensation and benefits)
Manpower Demand
Average Annual Growth
0
2022
Actual
0
2026
Forecast
0
Note(s):
(1) The figures included Employees + Vacancies (Full-time and Part-time).
(2) The manpower forecast is based on the statistical modelling of relevant economic indicators which reflect important changes in the local economy, demography and labour market.
All the percentages are rounded to nearest 0.1%.
Report
- Catering
- 2022 Manpower Survey Report
An Encouraging Business Environment
Hong Kong has returned to normalcy in the post-COVID 19 era. The fast and convenient links with the Mainland and the rest of the world have resumed and different businesses in the city are gradually reviving. The Government has also launched the "Happy Hong Kong" campaign, which features a wide range of fun and interesting activities across Hong Kong for citizens to enjoy happy moments together. It is hoped that the campaign can help stimulate local consumption and boost the economy.
- Catering
- 2025 Manpower Update Report
Navigating Challenges, Seizing Opportunities
Hong Kong’s catering industry is navigating a complex and evolving landscape shaped by economic pressures, rising operational costs, and shifting consumer behaviours. With increasing competition from neighbouring regions and changing expectations among younger workers, businesses are rethinking their staffing strategies and service models. This overview explores key challenges such as recruitment difficulties, industry image, and training needs, while highlighting opportunities for innovation, cultural integration, and collaboration across sectors. As tourism and events gradually rebound, the industry is poised to embrace transformation and build a resilient, future-ready workforce.